

Last updated on 24th November 2023
In this article we’re going to tell you everything you need to know about YouTube analytics, including the 23 metrics to track for success.
If you want to see real success on YouTube, you can’t just post and pray. You need a strategic plan.
So let’s take a look at why measuring YouTube analytics is important, and the 23 metrics you need to track for success…
Why measuring YouTube analytics is important
It’s important to track and analyse your YouTube analytics because these figures can help you understand what works for your channel (and what doesn’t) so that you can focus on the best areas for growth and success.
With YouTube analytics, you can really drill down and make decisions on everything about your channel, from what thumbnails gain the most attention, to what themes your subscribers would like to see you explore more often.
When you measure your analytics you can make specific goals and monitor your progress towards those goals, instead of posting blindly and just hoping for success!
How to find your YouTube analytics
To find your YouTube analytics, simply login to your account, click on your icon in the top-right, and then select YouTube Studio:
You’ll see a brief overview of your analytics here:
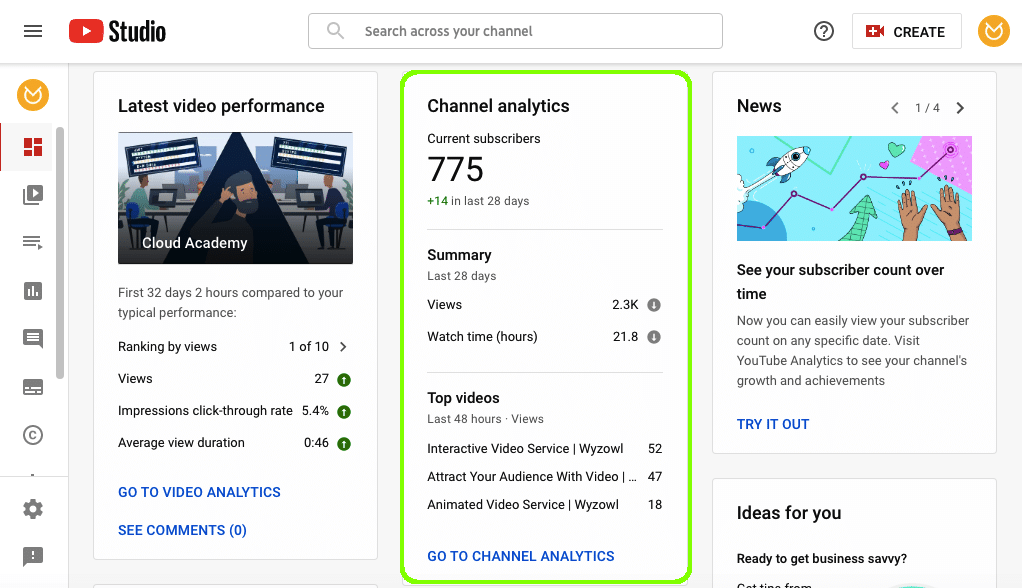
But to drill down further, head to the Analytics tab on the left-hand side or click “go to channel analytics”:
23 YouTube metrics to track for success
At first glance, your analytics page can be a little bit overwhelming.
From the overview screen, you’ll be able to see your views, watch time, and subscribers over the past 28 days:
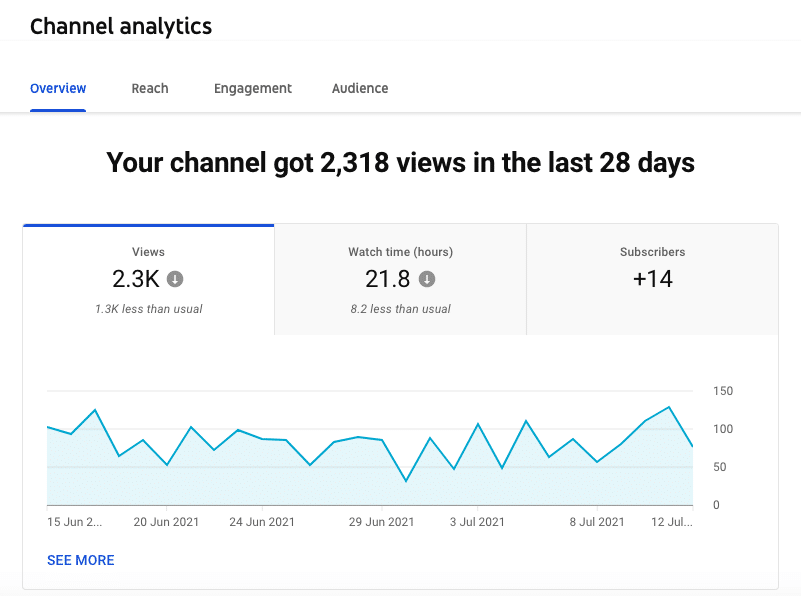
You’ll also be able to see your top videos for this period, so you can quickly discover what’s popular with your audience:
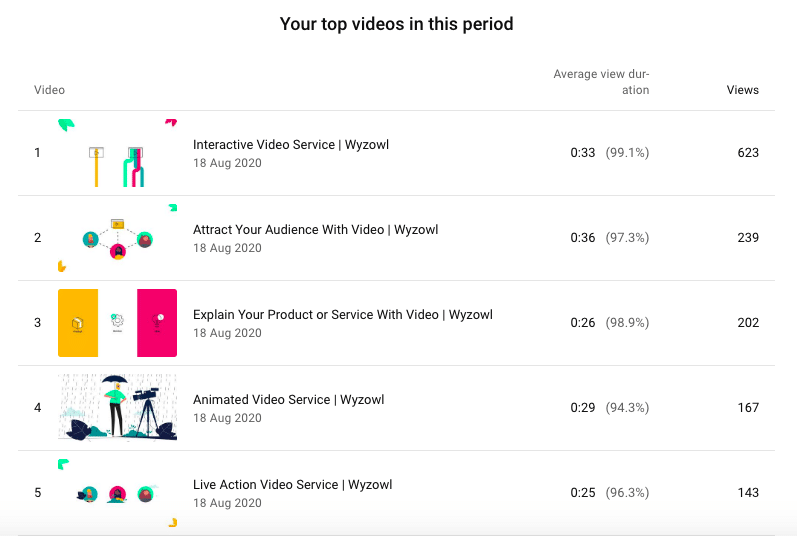
But to gain real insight, you need to focus on specific metrics. We’ve broken down all of the most important metrics and will also show you how to find them.
Reach metrics
The reach tab covers, as the name suggests, the reach of your channel and videos. There are 7 important metrics to track here.
1. Traffic source types
The traffic source types graph shows you where your viewers have come from and how they’ve found your videos:
This is important to track because it shows you where to focus your marketing efforts. Our graph shows that YouTube Advertising is our biggest traffic source, whereas YouTube search is one of the lowest.
With this information, we can choose to focus even more on YouTube advertising or try to improve our SEO so that we can be found by search more often.
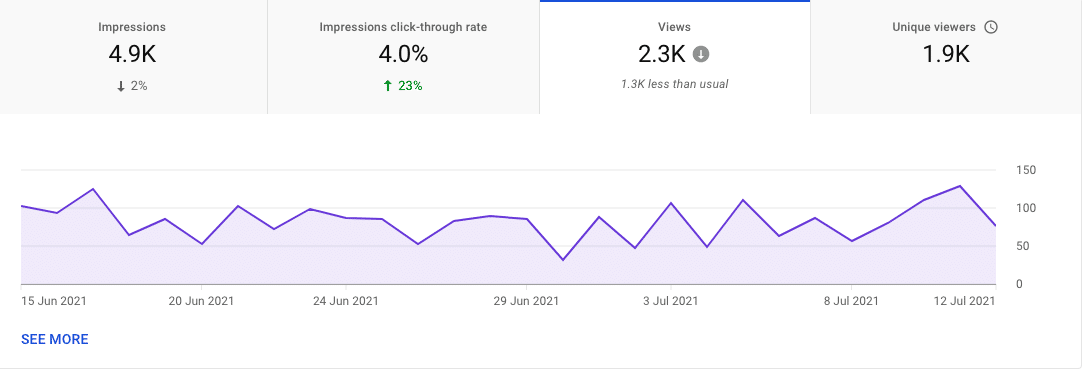
2. Impressions
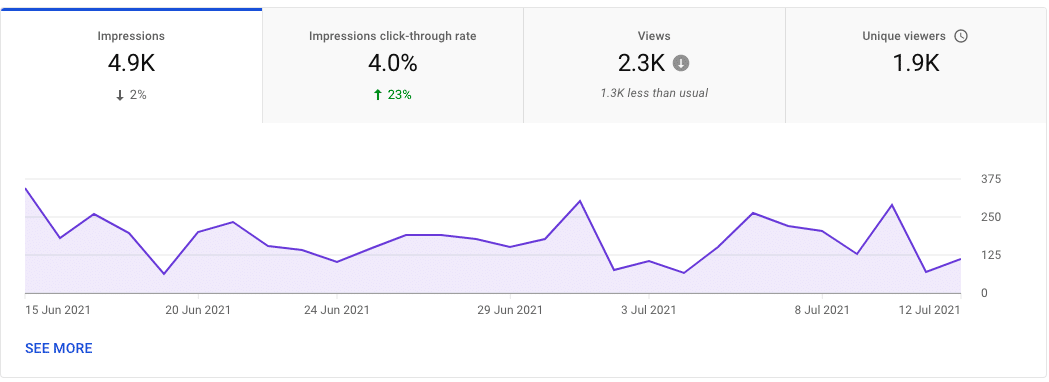
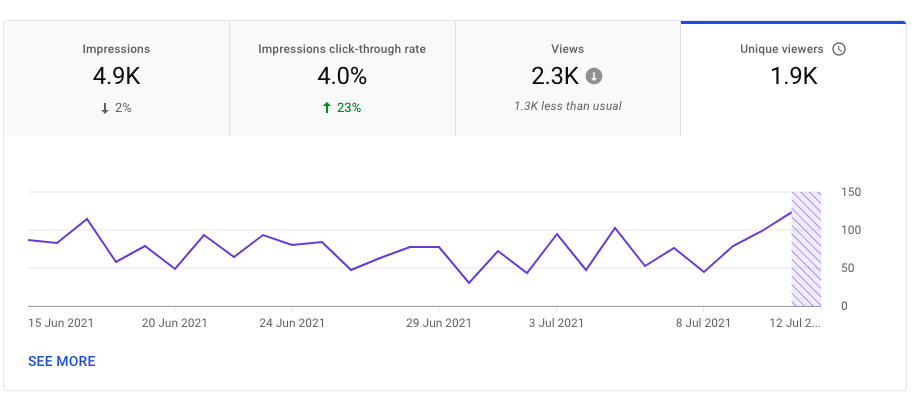
Impressions means how many times your video thumbnails were shown to people on YouTube. From the reach tab, you can view your impressions over a period of time and also see whether they’re trending up or down:
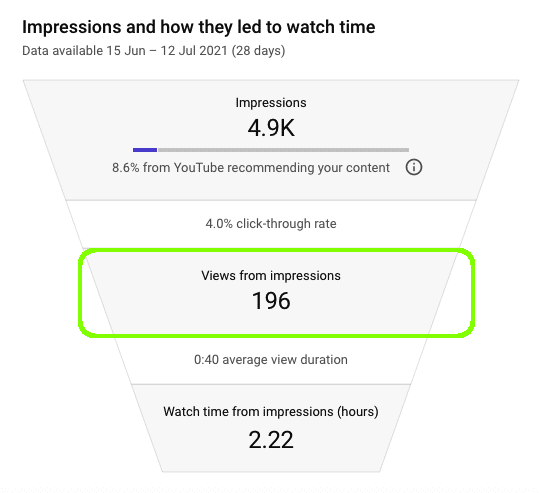
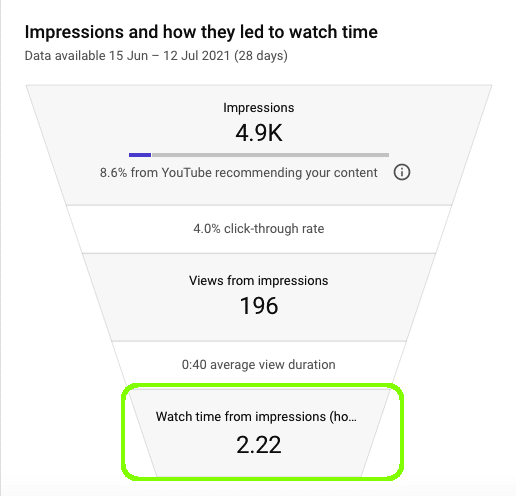
You can also view your impressions and how they led to watch time, at a glance:
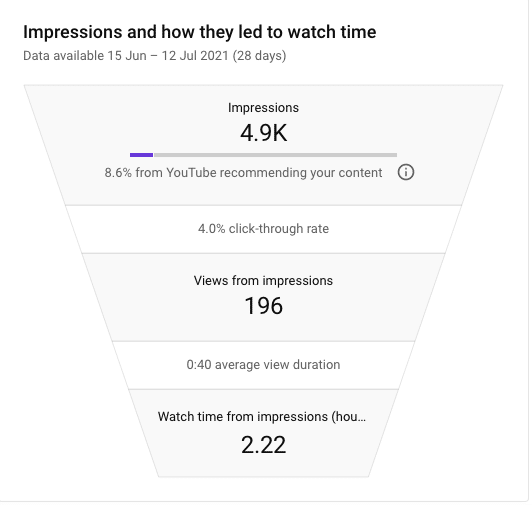
This handy funnel shows how many impressions your videos got and then how many of those were clicked on to result in views.
3. Views
And then of course we have views. Views is one of the most popular metrics that video marketers track. When we asked video marketers how they measure success, 58% said success was determined by number of views.
The view metric is important because a sharp upward spike can help you spot high-performing videos. And, more generally, you can also use this graph to determine the best time to post new videos.
4. Click-through rate
Leads and click-throughs were the next most important metric to track according to the video marketers we surveyed for our Video Marketing Statistics 2021 report – with 55% agreeing.
Your impressions click-through rate shows you how many people clicked on your video from an impression:
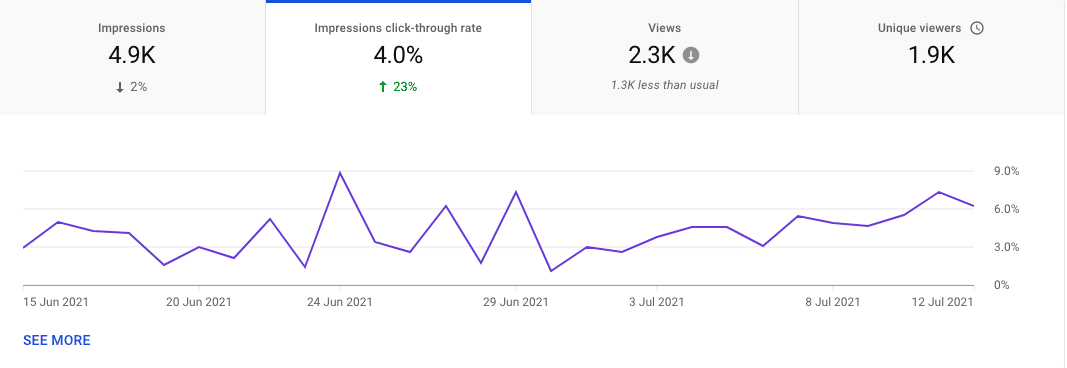
You can see this figure as a percentage or as a number within the funnel graphic:
Tracking the click-through rate of your impressions can help you find out which of your thumbnails are the most clickable.
5. Average view duration (from impressions)
From the funnel, you can also see the average view duration your videos received from impressions.
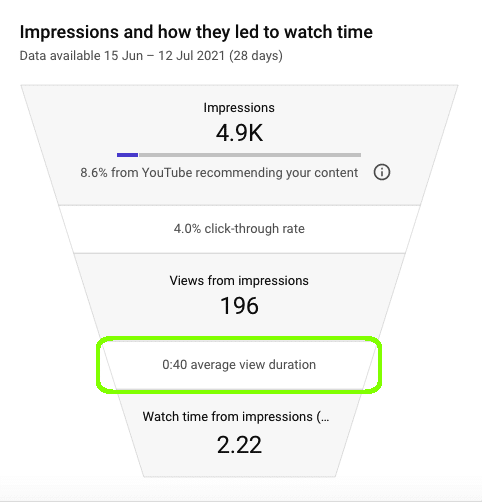
This shows you how long the people who clicked on your thumbnails stayed to watch your videos for, on average.
6. Watch time (from impressions)
Watch time (from impressions) is a similar metric, but instead of showing you an average view duration it shows you the total amount of minutes watched during the selected period.
The funnel gives you a quick summary:
But if you go back to the Overview page you can get a deeper insight into when and how that watch time was accrued:
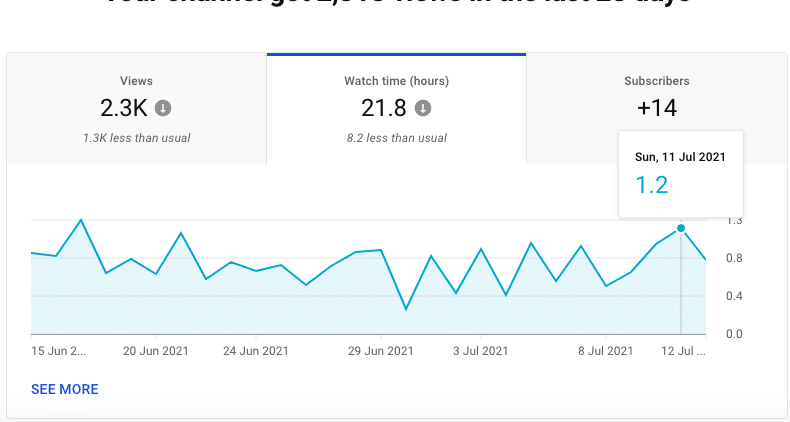
Watch time is extremely important because it allows you to see what type of content holds your viewers’ attention the longest.
It’s also great for performance on YouTube in general because the longer people watch and enjoy your videos, the more likely your videos will be recommended to your audience.
7. Uniques
The last metric to mention on the Reach tab is Uniques. This shows you how many unique viewers your videos are getting within the date period.
You can use this metric to find out the best days and times to post, based on the success of your previous videos.
Engagement metrics
The next tab is the Engagement tab. Engagement is important because it allows you to see how people are interacting with your videos.
There are 4 important metrics to track for success when it comes to YouTube engagement.
8. Watch time
We’ve already mentioned watch time (from impressions), but the engagement tab shows you overall watch time from all sources.
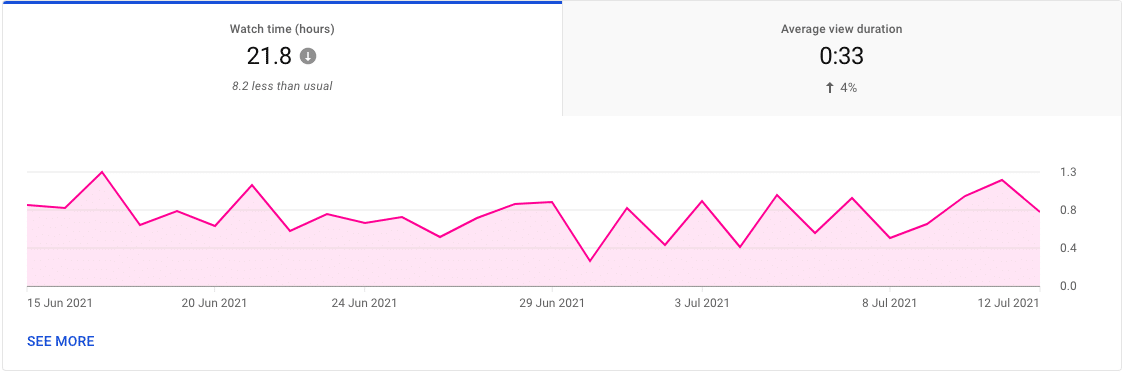
You can view this as a graph that shows how many hours of watch time your channel has received over a selected date period:
And you can also see your watch time by video and by playlist:
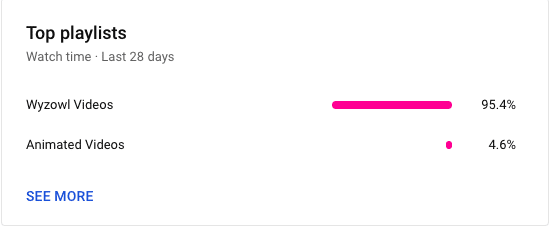
This gives you a wealth of data that can inform your marketing strategy. At a glance, it’s easy to see your most popular videos and the most popular days to publish a video on YouTube.
9. Average view duration
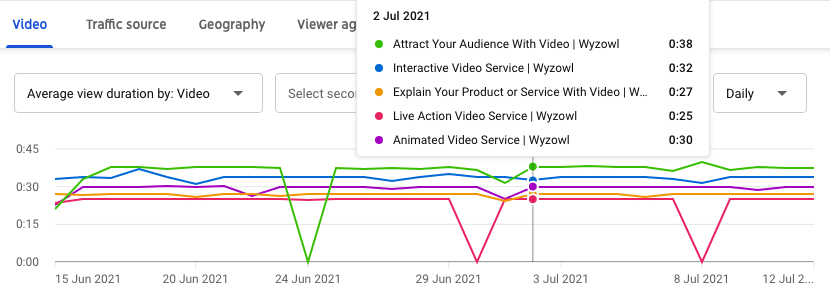
The average view duration graph tells you how long people watch your videos for, and it also lets you know whether this is trending up or down (over your selected date period).
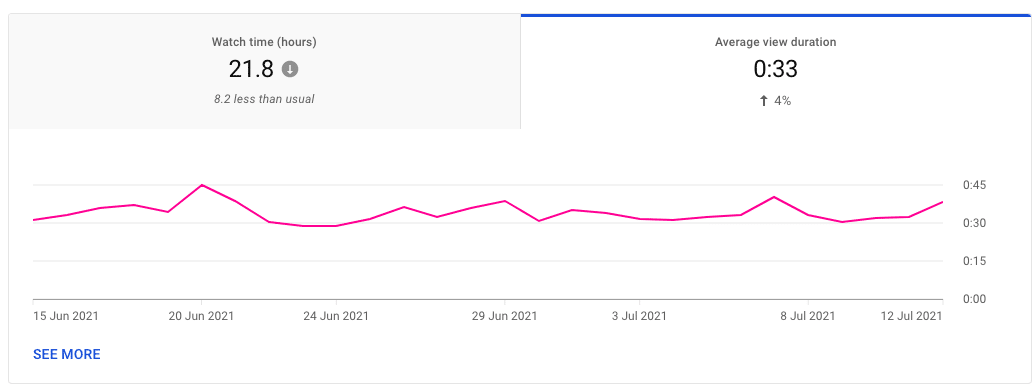
By clicking See More, you can drill down even further to see exactly which videos have been watched on any given day – and for how long.
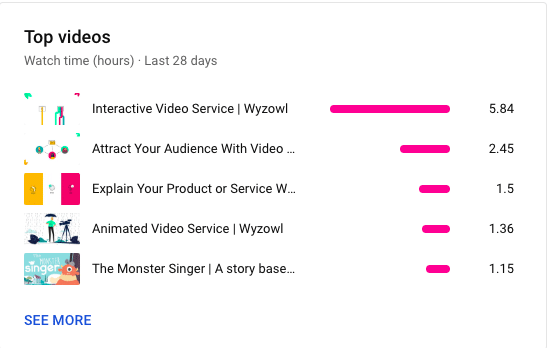
10. Top videos
You can also drill into the top videos section to see your watch time per video. The graph view makes it easy to spot any significant trends:
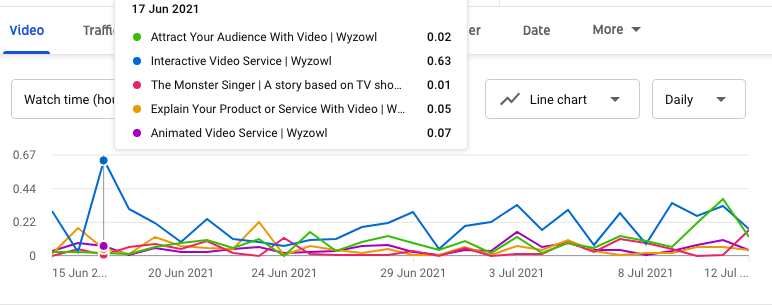
And the list view allows you to scroll through every single one of your videos in order of popularity. You can see watch time, but also add any other metric that you’re interested in so you can compare your videos and find patterns that can help you increase your success on YouTube:
11. Top videos by end screen
The end screen of your videos is where your all-important call to action is. This is what you want your viewers to do after they’ve watched your video. It could be “Visit our website!” or “Sign up for a demo!”
YouTube allows you to see your top videos by end screen so that you can find out which are the most popular and hopefully increase your click-through rate on the rest of your videos.
Audience metrics
The next tab is the Audience tab. It’s so important to get to know your audience as well as you can. When you know your audience, you can understand what kind of videos they want, and create more of those to increase your YouTube success.
There are 8 important metrics to track for success when it comes to your audience.
12. Viewers
The first metric that’s visible on the audience tab is returning viewers versus new viewers:
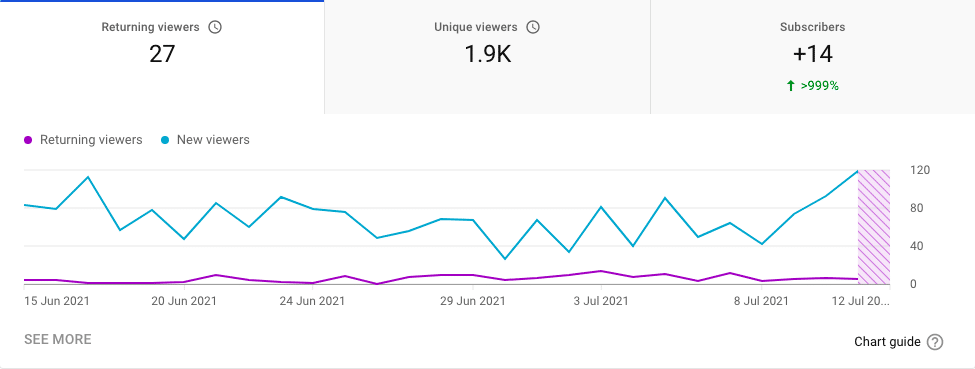
Returning viewers are, of course, people who have watched your videos before, and new viewers have never been to your channel before.
This is an important metric to track because by growing your returning viewers you can start to build a loyal audience.
13. Subscribers
The ideal next step from increasing your returning viewers is increasing your subscribers. The subscribers graph allows you to see how many new subscribers you have, and also if you’ve lost any:

Tracking this metric can help you to understand why people subscribe or unsubscribe to your channel – for example, in your videos you could start asking your viewers to subscribe (if you don’t already) and see if that has an effect on the rate of new subscribers.
Of course, the more subscribers you have, the better your chances are for success on YouTube.
14. When your viewers are on YouTube
Knowing when your viewers are on YouTube is an invaluable metric to track. This can help you plan so much, from scheduling your video content to planning a live stream.
By posting your videos when your viewers are already on YouTube, you can work to increase your views and engagement.
15. Other videos/channels that your viewers watch
As you start to build your audience, you’ll also be able to access data on the other videos and channels that your viewers are watching.
This can help you improve your own channel because it gives you a good idea of the kind of content your audience responds to.
In addition to that, it also gives you a list of potential channels that it would be great to collaborate with. According to the YouTube Creator Academy, collaborations can be a powerful way to extend the reach of your channel.
16. Watch time (from subscribers)
This metric allows you to see what portion of your views (in a given date period) came from subscribers and what came from non-subscribers.
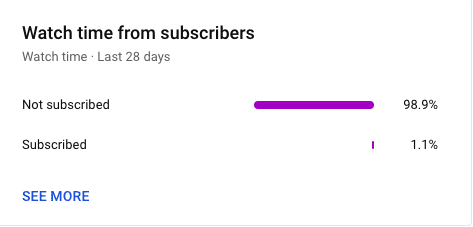
This is important to track because it can help to inform your future content. For example, if you find that your subscribers watch a certain type of content more (like Q&As) then you can tailor your messaging and end screens accordingly.
Most channels will receive a lot more views from non-subscribers than subscribers, but if there is a large discrepancy between the two figures you can use this information as an indication that you need to change your tactic and find new ways to encourage people to subscribe.
17. Top geographies
The top geographies metric allows you to see where your viewers are from:
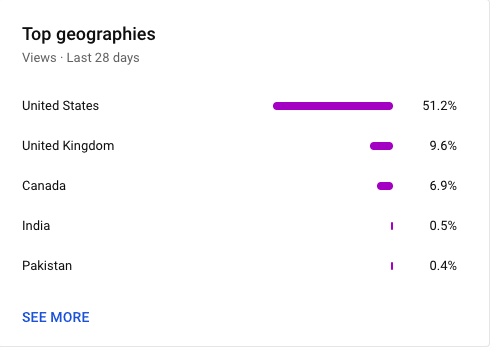
By clicking See More, you can get an even more in depth look at the figures:
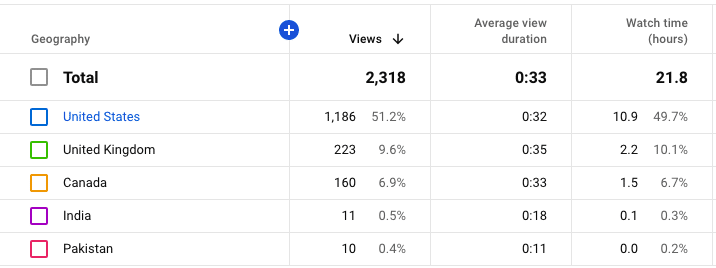
Knowing where your viewers are is another important metric that can help to inform your video marketing strategy.
As you can see from the above screenshots, most of our audience is based in the United States, but our brand is based in the UK.
Knowing that most of our viewers are American, we can use this information to switch up our content (perhaps remove any British slang!) and also adjust our posting schedule to suit US time zones.
18. Age and gender
Just as the top geographies section tells you where your viewers are, the age and gender metric gives you valuable information about who your viewers are.
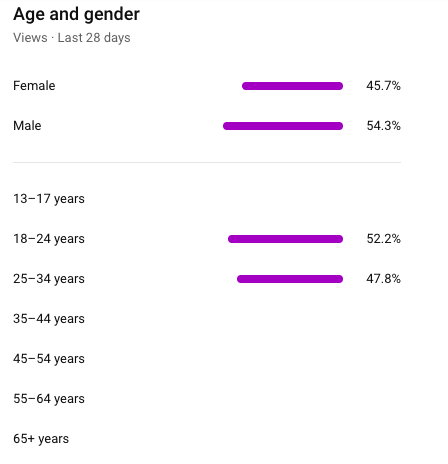
Our viewers are split fairly equally between male and female, and fit firmly into the age group of 18-34.
We can use this information to tailor our content to our audience to increase engagement and hopefully reach more people who match this demographic.
19. Top subtitle language
The final audience metric of note is the top subtitle language. This shows you your channel’s audience by subtitled language:
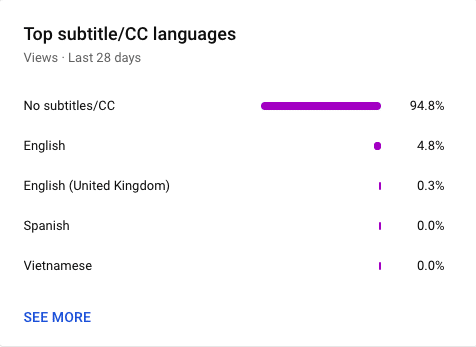
It may not be a relevant metric for all channels, but for some – such as travel or language learning videos – this will be really helpful for figuring out what subtitles you need to add to your videos.
Advanced mode
There are a couple of other metrics that don’t fit into the above categories that are still really important to mention.
These metrics help you to drill down even further, giving you the best chance of success on YouTube.
20. Realtime report
From the overview screen you’ll be able to see your realtime report. As the name suggests, this gives you access to realtime metrics, including your subscriber count, views, and top videos:
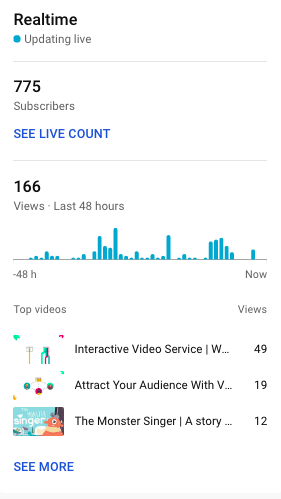
The bars represent how many views your videos have received per hour over the last 48 hours.
By clicking See More, you can even access metrics for how many videos have been viewed in the last 60 minutes:
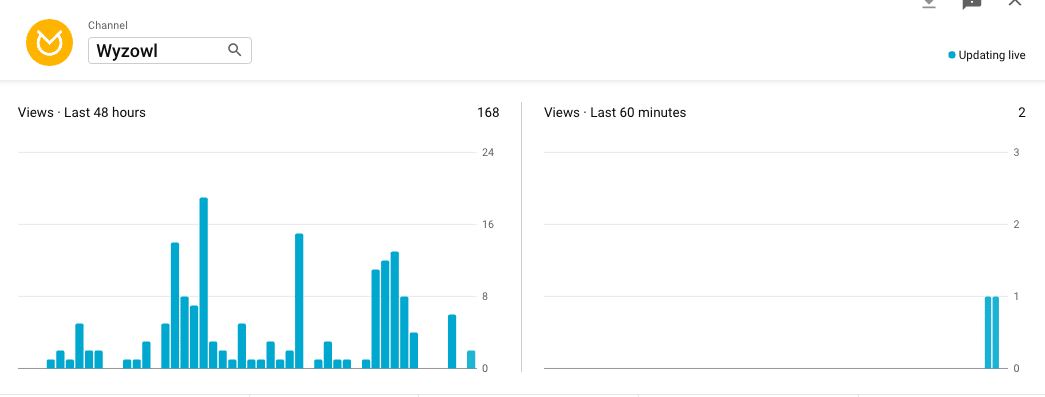
This real-time insight allows you to make adjustments to your channel on the fly.
21. Views by device type
Clicking Advanced Mode from the overview screen will take you to a new analytics page that offers you more insight into your data.
By clicking the More tab you can select from a number of metrics that may interest you. Views by device type is one of the most interesting metrics here as it allows you to see how your viewers are watching your videos:
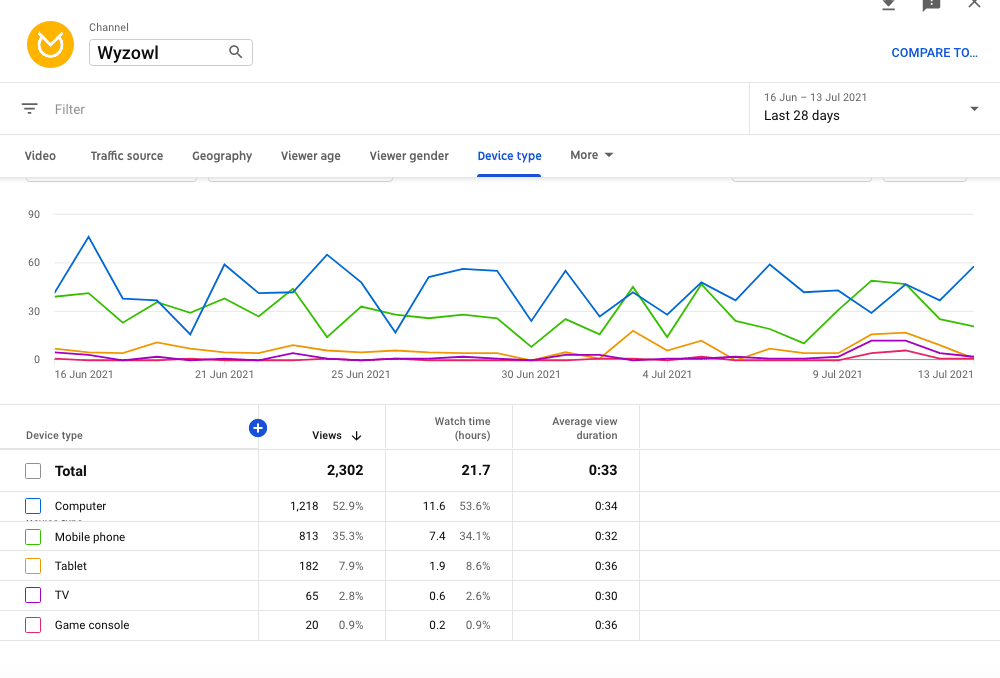
This can help you to understand how important it is to optimise your videos for mobile.
22. Playback location
You can also find the playback location metric here. This allows you to see where viewers are watching your videos – on YouTube or elsewhere online.

This metric is great if you have your videos embedded to external websites (outside of YouTube). It allows you to see how many times your videos are being viewed on your external sites so you can judge their effectiveness.
23. Compare to…
This isn’t technically classed as another individual metric to track, but it is important. By using the ‘compare to…’ functionality you can compare video performance over a period of time:
You can track your year-over-year performance, or compare your performance over certain periods, and even compare how each video performed during its first 24 hours.
By comparing your videos and your channel performance you can try to emulate any past successes and avoid repeating any past failures to confidently steer your channel towards success.
Final thoughts
Tracking these 23 metrics will give you such an incredible insight into your YouTube channel and allow you to make smart decisions so that you can grow with ease.
To find out more about how to improve your success on YouTube, check out some of our other articles:
The 11 Best YouTube Keyword Tools
YouTube SEO: 10 Ways to Rank Higher in 2024
YouTube Banner Size For All Devices – 2024 Guide